The False Breakout Trap
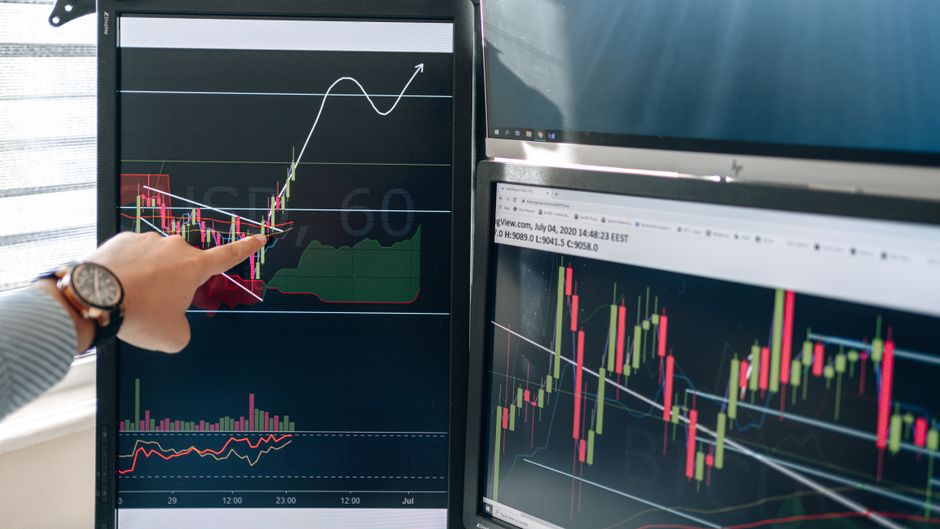
Traders often chase a breakout candle that lacks volume and find themselves trapped on the wrong side of the trade. The observations at orb trading five minute microsith document how this failure mode occurs within the first fifteen minutes of the session. A failed opening range breakout typically leaves a trail of liquidity behind, as large orders absorb the momentum of retail participants during the market open.
The Mechanics of the Liquidity Grab

A liquidity grab happens when price moves past a psychological level or a previous session high to trigger stop orders. This movement provides the necessary volume for larger participants to fill significant positions without moving the price against themselves. The candlestick pattern often shows a long upper wick or a shooting star shape on the 5 minute timeframe. This candle penetrates the level but fails to hold, signaling that the upward move was a trap designed to find sellers. Once the stops are hit, the price reverses rapidly back into the range.
Identifying the False Breakout Pattern

The failure starts with an aggressive candle that exceeds the opening range boundary. A high volume spike accompanies this move, but the close of the candle occurs near the low of its range. On a 15 minute chart, this looks like a sudden expansion followed by an immediate contraction. The presence of a heavy wick indicates that the supply at that level was greater than the demand. Instead of a continuation, the price reverts to the mean. This reversal is often faster than the initial breakout attempt because the momentum shifts from buyers to sellers in a single candle.
Volume and Price Divergence
Successful breakouts require sustained volume and consecutive bullish candles. A false breakout shows a divergence where the price makes a new high but the volume on the following candle collapses. This lack of follow through suggests the move was driven by thin liquidity rather than institutional accumulation. Analyzing the 30 minute range helps confirm if the move was a true shift in sentiment or a temporary spike. If the price cannot maintain its position above the previous high, the trap is set. The resulting move often targets the opposite side of the range.
Execution and Failure Modes
Entering a trade during the initial impulse often leads to being caught in the reversal. A mechanical approach requires waiting for the candle to close back inside the established boundaries. The intraday volatility during the first hour is high, and price often wiggles around the boundary to induce premature entries. Monitoring the relationship between the current price and the session high provides a signal. When the price breaches the level and immediately loses its footing, the trap is confirmed. The exit should be planned before the entry is even made.